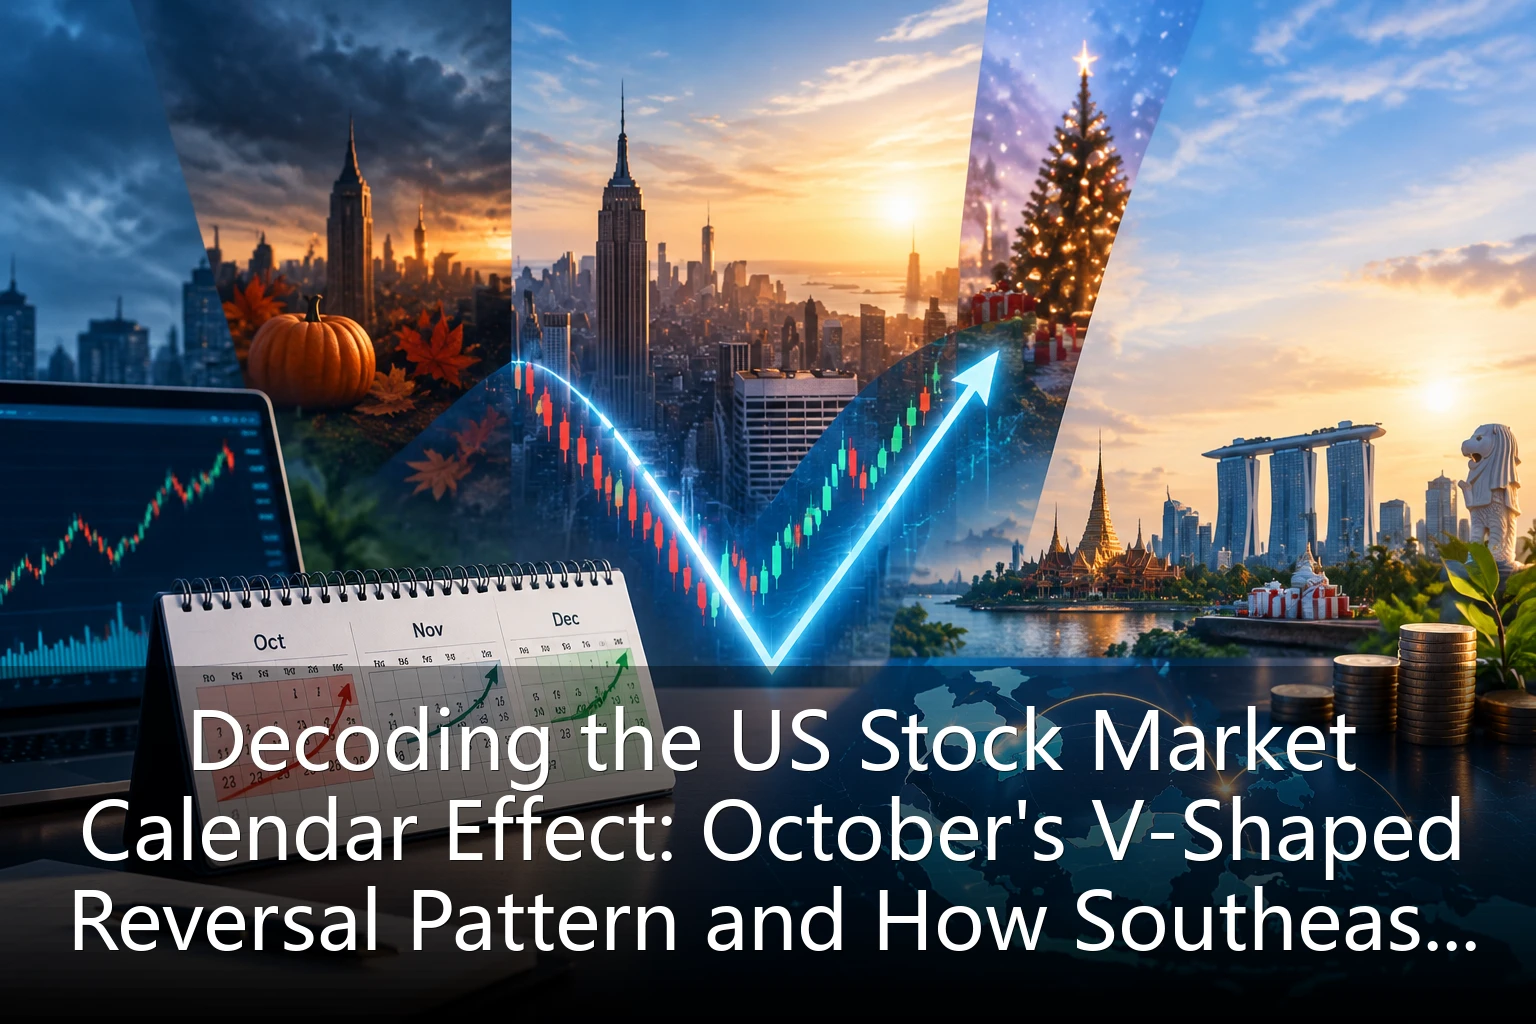
Every year in mid-October, US stock trading enters the most closely watched calendar window of the year. From 1929 to 1987 and again in October 2008, "October" seems bound to the word "crisis" in investors' memories. Yet setting aside impressions and returning to nearly a century of statistics, the conclusion is quite different: October is in fact one of the months with the most frequent "V-shaped reversals" in US market history, and it is precisely the launch point of the Q4 year-end rally. For Southeast Asian investors holding US equities, understanding the seasonal patterns hidden in the calendar is often more actionable than predicting the index's short-term direction.
1. The October Paradox: "Crisis Month" or "Reversal Month"?
The impression of October's "danger" comes from a few extreme samples. The 1929 crash ushered in the Great Depression, "Black Monday" on October 19, 1987 saw a single-day plunge of more than 20%, and in 2008, after Lehman Brothers collapsed, the financial crisis fully erupted in October. These memories run so deep that the "October effect" once became a byword for panic.
From a probability standpoint, however, October has another face. Several major bear-market bottoms in US market history occurred between September and October: in 1974, 1990, 1998, 2002, 2011, and 2022, the market bottomed during this period and began sustained rebounds. The reason lies in October's unique "dual-engine" structure—the concentrated release of risk events, combined with the simultaneous gathering of long-term bargain-hunting capital, makes it a classic window of "volatility first, reversal to follow."
- Volatility dimension: October has historically been a high point of the year for the VIX fear index, and experience shows volatility peaks often coincide with interim lows;
- Valuation dimension: valuation pressure accumulated over the first three quarters is often released between September and October, making room for year-end repricing;
- Flow dimension: after institutions finish rebalancing at the end of Q3 and the year-end performance-ranking battle begins, the direction of major funds' offense and defense typically shifts around mid-October.
2. The Three-Phase Calendar Code from Mid-October to Year-End
Phase One: The Earnings-Season Test (mid-to-late October)
Mid-to-late October is the peak disclosure period for Q3 US earnings and one of the times of the year when individual stock performance diverges most sharply. Historically, October's violent swings have mostly been tied to earnings season: guidance from leading companies directly rewrites the index path, and the market's recalibration of next year's profit expectations is completed through this "report-card test." In other words, October's turbulence is not pure risk but more like a "checkup" for the market.
Phase Two: The November Door-Opening Effect
The Wall Street adage "Sell in May and go away" points precisely to the calendar divide between November and April of the following year. Statistics over past decades show that November and December rank among the S&P 500's best win-rate months, market breadth usually improves markedly, and year-end flow effects and holiday-spending boosts also cluster in this phase.
Phase Three: The Santa Claus Rally and the January Effect
The last five trading days of December plus the first two of January are called the "Santa Claus rally" by the Stock Trader's Almanac; historically the odds of gains in this period are notably high, and its absence is often read as a warning signal for the following year. Right after, the small-cap "January effect" kicks in, with style rotation running from year-end into early next year, giving swing traders a clear rhythm to follow.
3. A Special Variable in 2026: The Midterm Election Year's Closing Window
Placing the calendar effect into 2026's macro cycle, one variable cannot be ignored—this is a US midterm election year. Historical experience shows that the first half of a midterm year often underperforms on policy uncertainty, but from Q4 of the election year through the first half of the next, it is one of the strongest phases of the four-year presidential cycle. The underlying logic: once uncertainty is resolved, corporate capex and institutional risk appetite tend to recover together; historically, the twelve months after a Q4 bottom in a midterm year clearly beat the average of other periods.
Of course, midterm-year seasonality is not guaranteed to trigger, and this year the market still faces its own tests: the sustainability of AI investment, the actual implementation of the Fed's policy path, and trade and geopolitical disruptions to corporate earnings could all alter the calendar script's rhythm. But at least on historical probability, Q4 2026 sits in a statistically bullish zone.
4. Lessons for Southeast Asian Capital: Using the "Calendar Toolbox" Wisely
For institutions and individuals in Singapore, Thailand, and elsewhere holding US equities, the calendar effect is not a forecasting tool but more like a framework for money management and risk control. Combining the patterns above, there are at least three actionable takeaways:
- Position timing: treat the mid-to-late October volatility window as an evaluation period for building and adding positions—avoid chasing highs before earnings are released and instead accumulate in batches in high-volatility zones;
- Instrument selection: in Q4's environment of "shifting from high volatility to trend," broad-based ETFs and quality leaders are more efficient to hold, with defensive assets serving as portfolio buffers;
- Cross-market linkage: changes in Treasury yield expectations behind the calendar effect directly affect the valuations of interest-rate-sensitive sectors such as Singapore REITs and Thailand's SET; investors can weigh "US Q4" and "local rate-sensitive assets" within a single portfolio perspective.
It must also be stressed that Southeast Asian capital investing in US equities must simultaneously consider how currency fluctuations erode net returns. Historically, the dollar index often trades in a range during the year-end repricing phase; using FX hedging tools to lock in part of the currency exposure is an indispensable part of a mature cross-border allocation framework.
5. Risk Warning: The Calendar Is Probability, Not Prophecy
The calendar effect is essentially the distillation of historical statistics; it describes probability distributions, not inevitable paths. October 2018 still saw a sharp selloff, and the 2021 year-end rally was interrupted by rate-hike expectations. When macro shocks, earnings blowups, or liquidity events break the seasonal script, blindly betting on "reversal patterns" only amplifies losses.
A more robust approach is to use calendar seasonality alongside fundamentals, valuation, and flow data: when seasonal tailwinds resonate with improving fundamentals, raise the weight of offensive positions; when signals conflict, stay defensive. After all, the calendar effect's greatest value is reminding investors that at the moments when market sentiment is most prone to extremes, staying calm and disciplined is itself a source of excess return.
Overall, standing in mid-October 2026, US equities sit at the dual calendar window of the "October V-shaped reversal pattern" and "year-end effects," compounded by the historical boost of a midterm election year, giving the Q4 rally a probability edge worth taking seriously. For Southeast Asian investors, rather than predicting where the index will go, first figure out where the calendar's beat falls—then leave the rest to discipline and time.